by epianalysis
We often hear that poverty and inequality contribute to poor health, but how much difference do they actually make? More than smoking? Less than fast food?
Over the past few weeks, three landmark papers have emerged that actually quantify how much social factors affect the health of Americans. One study manages to put numbers on the “upstream social determinants” of ill health–from racial segregation to low education; another compares the costs and benefits of neighborhood health improvements with expanded health insurance or more preventive medical care; and the third finally answers the question of how much health insurance coverage actually makes a difference to the lives of the poor. In this week’s blog, we look at how researchers attach numbers to “social factors” behind ill health, and quantify how community-based public health efforts stack-up to the latest drug or medical invention.
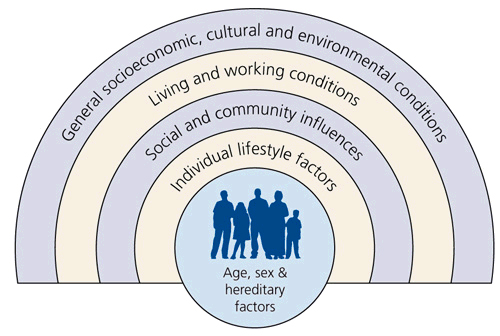
The mechanisms explaining why neighborhood social factors contribute to ill health are often called “complex and difficult to individually isolate”; how can we truly tell that a heart attack resulted from being pushed out to a semi-industrial neighborhood without access to a doctor or a quality grocery store? How do we calculate whether this segregation was more pertinent to a person’s death than just the “proximal” factors–that they ate a high-fat diet, or didn’t get treatment for their high blood pressure? The challenge of addressing the “social determinants of health” (whose classic framework for analysis is depicted in the diagram below) is that identifying those determinants requires us to capture a lot of real-world complexities in specific detail, so that we can move from the most immediate pathology of disease (fatty diet = cholesterol = heart attacks), that are straightforward to establish in laboratories and clinical trials, to the risk factors that make pathology possible in the real-world (segregation = poor grocery stores = fast food).
Calculating the PAF
In 1993, two researchers at the U.S. Department of Health and Human Services took the first step towards zooming-out to identify the social determinants of health, when they published a landmark paper in the Journal of the American Medical Association (JAMA), entitled “Actual Causes of Death in the United States“. The paper had a simple premise: to calculate how many American deaths could be attributed to non-genetic factors. They identified deaths from tobacco (an estimated 400,000 deaths), diet and activity patterns (300,000 deaths), alcohol (100,000), microbial agents (90,000), toxic agents (60,000), firearms (35,000), sexual behavior (30,000), motor vehicles (25,000), and illicit use of drugs (20,000). While the details of how they arrived at these numbers are described further below, the paper created furor not because the numbers are surprising (in this day and age, the idea that half of deaths in the U.S. stem from non-genetic factors, and mostly from diet and tobacco, is not surprising), but because the paper came out in the early 1990′s, when much of the medical establishment thought that mapping the human genome and discovering the right medications would solve the country’s health problems.

A few weeks ago, researchers at Columbia University zoomed out further: they recognized that alcohol, tobacco, and similar social pathologies are strongly related to the types of neighborhoods and families that people live around. So they went to the literature and asked: how much do the “big social factors” in neighborhoods–poverty, inequality, education–make a difference in numerical terms?
To calculate the number of deaths attributable to a social factor, they first estimated the relative risk (RR) of death associated with each factor. The relative risk is a ratio of the probability that you’ll die after exposure to a given factor (like tobacco) divided by the probability you’ll die if you’re not exposed to that factor. The researchers reviewed 478 previous studies and compared dichotomous categories of people–those who smoke tobacco and those who don’t, for example–to compare their death rates and calculate a relative risk of death from each factor. They then looked at how common that social factor was in the United States (e.g., the prevalence of tobacco smoking) to calculate the “population attributable fraction” (PAF) of deaths for each social factor. This is calculated as PAF = p(RR-1)/[p(RR-1)+1]. (Want to see where this formula comes from? Take a look at this derivation).
The PAF is the proportional reduction in mortality that would occur if exposure to a risk factor were eliminated (e.g., the number or percentage of deaths that would be avoided if no one smoked tobacco). Many diseases are caused by multiple risk factors, and individual risk factors may interact to produce an overall impact on disease. As a result, PAFs for individual risk factors often overlap and add up to more than 100%. We interpret the PAF as the number of deaths that would be eliminated if the risk factor were removed, not as the number of deaths that will occur if that risk factor were introduced into a new country (where the environment in which that factor works is different), or the numbers of deaths for which that risk factor is the only cause (it’s not that the PAF is the number of deaths caused by that risk factor and no other factors, but rather, the PAF deaths are those that we’d expect to be eliminated if the risk factor were removed from the given social environment). So do you have to adjust for all the “confounding” factors, like the fact that tobacco is related to poverty and a million other causes of ill health? No, in fact you shouldn’t “adjust” for confounders if you’re using the above PAF formula, because the adjustment would affect the RR ratio calculation differently in the numerator than in the denominator, producing bias (to see in detail why the unadjusted RR is preferable, see this paper).
The Columbia University researchers calculated the PAFs of major social factors in the U.S., and here’s what they found: approximately 245,000 deaths in the United States in 2000 were attributable to low education; 176,000 to racial segregation; 162,000 to low social support; 133,000 to individual-level poverty; 119,000 to income inequality; and 39,000 to area-level (neighborhood) poverty.

How does that compute in the grand scheme of things? The number of deaths attributable to low education is actually higher than the number caused by heart attacks (192,898), which were the leading cause of death in the U.S. in the year 2000. The number of deaths attributable to racial segregation is also higher than the number of deaths from stroke (167,661), the third leading cause of death in 2000, and the number of deaths attributable to low social support is comparable to deaths from lung cancer (155,521).
Calculating the bottom line
One of the principal arguments against intervening in the “social determinants of health”, however, is that addressing these factors is likely to cost more than paying for healthcare. It’s easier to give a cholesterol pill to prevent a heart attack, and much harder to address racial segregation. While perhaps this is true on a political level, the epidemiological feasibility and costs of addressing neighborhood determinants of health were addressed by another recent paper, published by leaders of the “Syndemics Prevention Network” at the Centers for Disease Control and Prevention (CDC).
That paper, recently published in the journal Health Affairs, uses a mathematical model of the US health system that features several hundred interacting elements describing the relationships at the national level that affect population health status, health equity, and health care costs over time. The model was used to compare three scenarios that are based on interventions that have been tested in the real world: (1) extending health insurance to all people (similar to the program in Massachusetts); (2) delivering better preventive medical care (simulating that doctors adhere more to guidelines for preventive and chronic medical care); and (3) enabling healthier behavior and improved neighborhood environments for health through a set of cost-effective measures that have been implemented before (ranging from smoking cessation programs to physical activity programs). They called these three interventions the “coverage”, “care” and “protection” interventions, respectively.
Even under a wide range of alternative scenarios, and after accounting for various uncertainties and pessimistic possibilities through sensitivity analysis, the authors found a consistent result: after 25 years, the coverage intervention would be expected to prevent about 880,000 deaths; the care intervention, 3.4 million; and the protection intervention, 4.5 million. The coverage intervention would increase cumulative costs by $1.513 trillion, and the care intervention would increase them by $1.134 trillion. In contrast, the protection intervention would save $596 billion.

Individually, both coverage and care would increase costs by increasing health care use and amplifying the cost-increasing impacts of price inflation and population aging. Protection, on the other hand, would increase total costs for the first six years, reflecting the program’s initial expenses, but would thereafter decrease total costs as program costs declined and disease and injury rates were reduced.

The Oregon health insurance experiment
That’s not to say that health insurance is a bad thing, or that only neighborhood social determinants are worth working on. Another recent paper is a major new report from the National Bureau of Economic Research (NBER), which shows that when the poor have medical insurance, they not only find regular doctors and see them more frequently for preventive care, but also end up feeling healthier, less depressed and are better able to maintain financial stability.
Seems obvious, no? Sadly, what would be an obvious conclusion to many lay people has been a subject of hot debate among healthcare analysts up to the time of this study. (Of course, it is interesting that the U.S. has the highest per capita number of healthcare analysts, and some of the shittiest per capita health statistics among developed countries, so maybe the analysts have their heads stuck up somewhere… but I’m not allowed to say that at the University).
It’s actually been debated for a long time whether insurance provides meaningful benefits to poor people, especially during the recent debate on Medicaid cuts. Some analysts argued that insurance isn’t really going to produce much benefit when there’s already a safety net in the form of emergency rooms and free clinics and hospital charity care (though the latter has been questioned after Yale-New Haven Hospital’s debacle). Also, because so many people who qualify for Medicaid have not signed up (probably because it’s so difficult to do so), several analysts argued that expanded coverage wouldn’t produce much benefit.
The NBER study puts many of those criticisms to rest. Previous research couldn’t resolve the question about insurance’s benefits because the people who didn’t have insurance were often in poor neighborhoods and had a number of other confounding issues like substance abuse, such that comparing them to the insured wouldn’t provide a fair comparison according to critics. But in 2008, Oregon had enough money to expand its Medicaid program. For two years, the program had just enough funding for 10,000 new participants. But 90,000 people applied; to be fair, the program decided to perform a lottery to give coverage to the 10,000 people who could get Medicaid during those two years, before the other 80,000 could be covered by the state budget. So for two years, people who were otherwise in similar social circumstances would be randomly assigned to insurance or not insurance–the first randomized control trial of insurance coverage.
The NBER followed these folks, and found that those with Medicaid were 35% more likely to go to a clinic (and 70% more likely to consistently go to one primary care medical home). They were 20% more likely to have their cholesterol checked. Women were 60% more likely to have mammograms. Overall, the group was 40% less likely to say that their health had worsened in the past year than those without insurance. They were also 25% less likely to have an unpaid bill sent to a collection agency and 40% less likely to borrow money or fail to pay other bills because they had to pay medical bills.
The NBER study–like the Columbia University study and the CDC model–attaches some numbers to what doctors and nurses see every day: the value of social protections for health, and the heavy risks that social realities bear on the ill. What they also highlight, however, is just how out-of-touch mainstream medical research seems to be from the daily problems facing the poor: while we focus on new genetics and the most expensive medical innovations, the real “bang for the buck” appears to be at the neighborhood and political level, not just in molecular biology.
20110806
How many Americans die from racial segregation? About 176,000 a year.
Subscribe to:
Post Comments (Atom)


No comments:
Post a Comment