Richard Florida takes a closer look at hate groups in the United States:
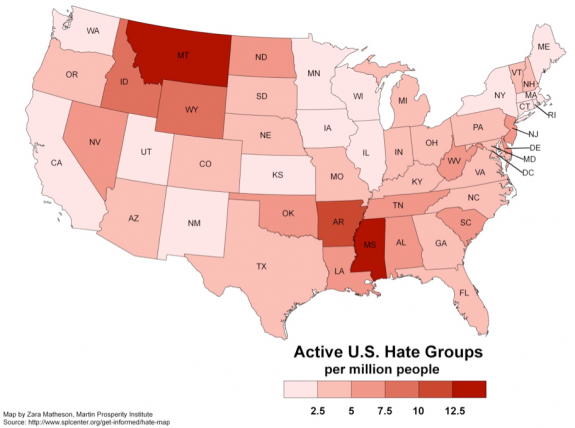
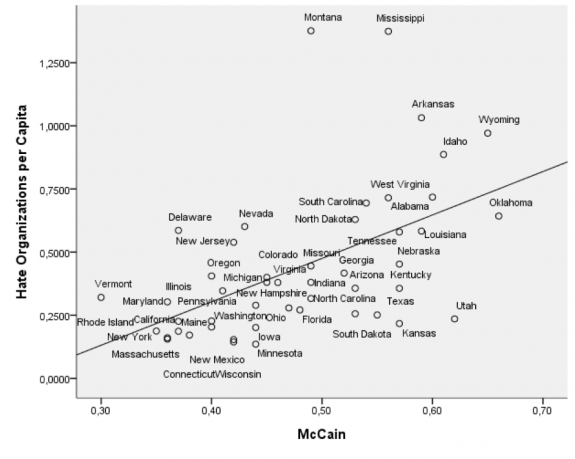
Since 2000, the number of organized hate groups -- from white nationalists, neo-Nazis and racist skinheads to border vigilantes and black separatist organizations -- has climbed by more than 50 percent, according to the Southern Poverty Law Center (SPLC). Their rise has been fueled by growing anxiety over jobs, immigration, racial and ethnic diversity, the election of Barack Obama as America's first black president, and the lingering economic crisis. Most of them merely espouse violent theories; some of them are stock-piling weapons and actively planning attacks.The map provides a basic state-by-state view of hate groups per capita. Montana and Mississippi have the highest rates. Straightforward stuff. The interesting part, however, is how the rate correlates to other factors, such as support for John McCain. The greater the support for McCain, the more hate groups per capita a state tends to have.

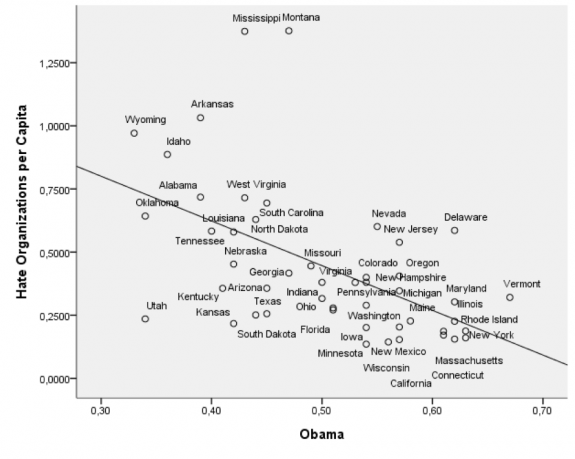
Conversely, here's the graph for Barack Obama versus hate groups per capita. Unsurprisingly, it's the opposite of the McCain graph:

There are correlations with religion, working class percentage, immigration count, and a number of others. I don't know enough about the topic to guess why these correlations exist (if you do, feel free to comment), but the correlations are pretty clear and worth a look.


No comments:
Post a Comment